
Hermes Snitchboard
From its catalog listing
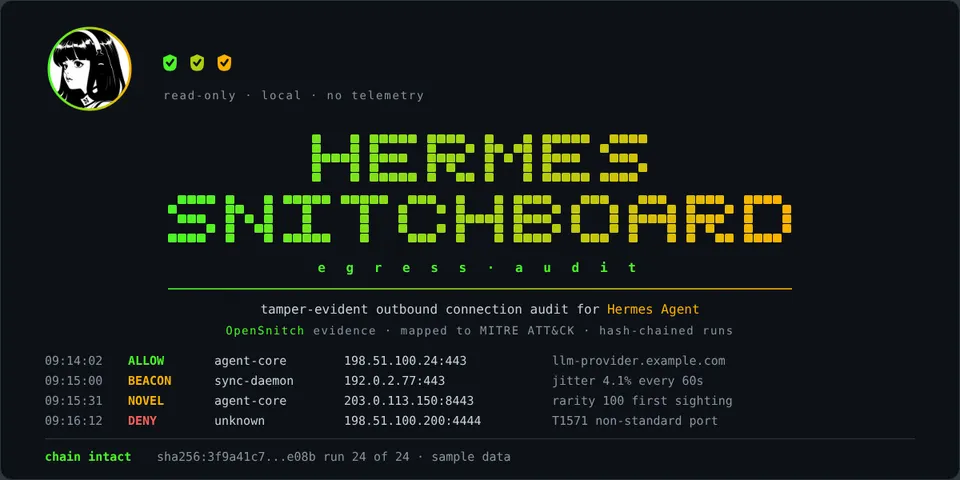
A dashboard tab that turns OpenSnitch connection evidence into plain-language findings mapped to MITRE ATT&CK, with a hash chain that makes alteration of stored history detectable. Hermes can tell you what it did and application-layer tooling can record which model requests it made; neither tells you what the machine actually connected to. The tab answers that from the firewall's own record of outbound connections and the process behind each one. It shows a summary of connections, denials, unique processes and destinations, AI traffic and unattributed traffic; an hourly coverage strip that renders a missing hour as a gap rather than as a quiet hour; findings carrying severity, confidence, the ATT&CK technique and tactic, the literal records behind the finding and one concrete next step; regular-interval destinations stated with both the benign and the malicious reading, with services on the configured expected list labelled rather than flagged; novel destinations ranked by rarity against prior runs; activity by AI process and by configured agent account; a per-run connection chart with a run that collected nothing drawn as a marked gap instead of a zero; byte volume where the firewall's connection tracking measured it; the daemon's reported state, the rules in force and open sockets; and an integrity panel that recomputes every link on request. Addresses, host names, hardware addresses, home directories and process arguments are masked by default, a deliberate control reveals them, and that control can be switched off entirely in settings. Until real runs exist the tab shows clearly labelled demonstration records built from addresses reserved for documentation (RFC 5737, RFC 3849, RFC 2606), so every panel is visible without installing OpenSnitch. Collection and viewing are kept apart on purpose: the half that runs inside Hermes never opens the firewall database, and the optional reference collector is run by the machine owner's own account, never by Hermes, which suits setups where Hermes runs under a different account from the person who owns the machine. The integrity claim is scoped deliberately: the chain attests to the order of stored records and to the digest each full record held when it was sealed, so a record that has since been trimmed keeps a shortened summary the chain does not cover, and that summary is a derived analysis aid rather than evidence. The chain makes alteration detectable; it does not prove what the network did, and anyone able to rewrite every record could recompute it.
Good to know before installing
registers no tools, no hooks and no middleware, and needs no environment variable. Its only surface is the dashboard tab and seven GET routes served by the user's own local dashboard at /api/plugins/hermes-snitchboard/ (health, settings, runs, runs/latest, runs/{run_id}, series, verify), which require the dashboard's auth ticket. It writes nothing to disk at all. It makes no network request, opens no socket, loads no external font, script or image, executes no subprocess, no shell command and no systemd unit, starts no background process, holds no credential and no OAuth client, and sends no telemetry. It reads three things: the run records in the directory named by its runs_dir setting, which may sit outside the plugin's own data directory and which the operator chooses; a settings.json in its plugin data directory when Hermes's own settings are unavailable; and the plugin's settings from Hermes configuration through the read-only helper hermes_cli.config.load_config_readonly, with plugins.plugin_storage.plugin_data_dir for the data path. Both of those imports are guarded and fall back rather than raise. Record files are opened with O_NOFOLLOW, symbolic links in the runs directory are skipped so nothing outside it can be reached through one, no value supplied by a client ever reaches the filesystem as a path, a file is never read past the schema's size cap, and every response is bounded in both row count and serialised bytes. Record data is rendered through React element construction with no innerHTML anywhere, because process and host names from the firewall flow through that code. Python standard library only; FastAPI comes from Hermes and no third-party package is added.
From its catalog listing.
How to install
- Install it. Hermes asks for any API keys it needs, then asks whether to turn it on.
hermes plugins install hermes-snitchboard - Said no? Turn it on later:
hermes plugins enable hermes-snitchboard - Restart Hermes so it loads the plugin.
Some plugins also need a sign-in or settings: see Full setup & settings. Memory plugins ask whether to become your memory provider instead. Steps follow the official plugins guide (opens in a new tab).
- Category
- Coding & developer tools
- Maintained by
- NeumannTechTips (Community)
- Needs
- No API keys declared
- Works on
- linux
- Needs Hermes
- 0.23.0 or newer
- Version
- 0.1.0
- In the catalog
- 2026-11-10
Known issues (from its catalog listing)
- The analysis thresholds in snitchboard/config.py (beacon window and jitter bands, novelty depth, coverage tolerance, transfer thresholds, detection and aggregate caps) carry their defaults in this release. Only the twelve settings declared in plugin.yaml reach the plugin from Hermes configuration, so a threshold placed in the configuration file is dropped without warning rather than applied.
- Developed and verified on Hermes Agent v0.23.0 on Fedora Linux with plugins.isolation: host. The same code runs elsewhere but no other platform or isolation mode was exercised.
- Chain verification carries a 40-second budget so it stays inside the plugin host's 60-second response ceiling. On a very large history it reports that verification did not complete and gives no verdict, rather than returning a partial one.
- A trimmed record keeps a shortened summary that the chain does not cover. The chain still attests to that record's position and to the digest its full form held when sealed, so the integrity panel reports how many links rest on sealed digests.
- The reference collector supplies no byte counts, because the OpenSnitch database holds none, so any record it produces reports volume as unavailable. The demonstration records carry byte counts, so that panel is populated in demonstration mode only.
- Account names appear in clear while home paths are masked. Masking them reaches finding text and evidence lines as well as the tables, so it is recorded as a v0.2.0 item rather than done late.
- The reference collector reads connection times as naive local strings, so it must run in the same time zone as the firewall interface. The hour repeated when clocks go back is ambiguous.
- OpenSnitch records connections only while its own interface is running, and its purge setting removes old rows. Both show as gaps or as runs marked no_data, never as an all-clear.
- aggregates.total_connections and aggregates.dropped hold the window's counts in a collected record but repeat the daemon's lifetime counters in a demonstration record. Giving them a single meaning is a v0.2.0 item.
Using the Hermes desktop app? See where plugins live

Full setup & settings ↗Source code ↗
More in coding & developer tools
All coding & developer tools plugins
New Hermes Agent updates every day on X. Follow @HermesWatcher